


U.S. Food and Agriculture Industries Economic Impact Study, 2025
Executive Summary
The 2025 Food and Agriculture Industries Economic Impact Study estimates the economic contributions made by the food industry to the U.S. economy in 2025. For the purpose of the study, the food industry includes any business involved in food agriculture, food manufacturing, food wholesaling, and food retailing (so-called “farm to fork”). John Dunham & Associates conducted this research, which was funded by The Goodstone Group. The study measures the number of jobs in food and agriculture related industries, the wages paid to employees, the value added, and total output. In addition, it measures the economic impact of the suppliers that support the food and agriculture industries, as well as those industries supported by the induced spending of direct and supplier industries.
Industries are linked to each other when one industry buys from another to produce its own products. Each industry in turn makes purchases from a different mix of other industries, and so on. Employees in all industries extend the economic impact when they spend their earnings. Thus, economic activity started in food and agriculture industries generates output (and jobs) in hundreds of other industries, often in states far removed from the original economic activity. The impact of supplier firms, and the “induced impact” of the re-spending by employees of industry and supplier firms, is calculated using an input/output model of the United States. The study calculates the impact on a national basis, by state, and by congressional district.
The study also estimates taxes paid by the industries and their employees. Federal taxes include industry-specific excise and sales taxes, business and personal income taxes, FICA, and unemployment insurance. State and local tax systems vary widely. Direct retail taxes include state and local sales taxes, license fees, and applicable gross receipt taxes. In addition, businesses pay real estate and personal property taxes, business income taxes, and other business levies that vary in each state and municipality.
The food and agriculture industries are dynamic contributors to the U.S. economy, accounting for about $4.02 trillion in output or about 7.90 percent of total national output.1 They employ approximately 24.04 million Americans who earned wages and benefits of about $1.05 trillion. Economic activity in the food and agriculture sectors generates as many as 23.14 million jobs and $5.51 trillion of economic output in supplier industries and sectors supported through induced spending. Members of the industries and their employees, and these supplier and induced industries, paid nearly $1.26 trillion in federal, state and local taxes. This does not include state and local sales taxes or excise taxes that may apply for specific retail products.
Summary Results
The food and agriculture industries (as defined in this study) include businesses involved in food agriculture, food manufacturing, food wholesaling, and food retailing. The food and agriculture industries reach into all corners of the United States, employing 24.04 million and generating $1.05 trillion in wages. Retail grocery businesses alone generate $369.51 billion in economic activity nationally. The direct employment of the food and agriculture industries is equivalent to 15.11 percent of total U.S. employment.
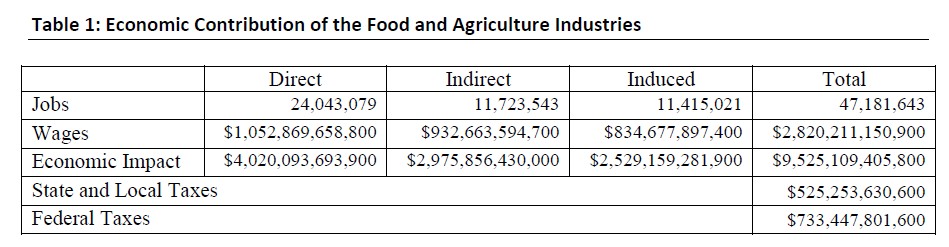
Other firms are related to the food and agriculture industries as suppliers. These firms produce and sell a broad range of items including tools and equipment, trucks, and shelving. In addition, supplier firms provide a broad range of services, including personnel services, financial services, advertising services, consulting services or transportation services. Finally, a number of people are employed in government enterprises responsible for the regulation of the food and agriculture industries. The industry is responsible for 11.72 million supplier jobs. These firms generate about $2.98 trillion in economic activity.2
An economic analysis of the industry will also take additional linkages into account. While it is inappropriate to claim that suppliers to the industry’s supplier firms are part of the industry being analyzed,3 the spending by employees of the industry, and that of indirect firms whose jobs are directly dependent on the food and agriculture industries, should be included. This spending – on everything from housing, to food, to education and medical care – makes up what is traditionally called the “induced impact,” or multiplier effect, of the food and agriculture industries. For 2025, the induced impact of the industry generates 11.42 million jobs and $2.53 trillion in economic impact, for a multiplier of 0.63.4
An important part of an impact analysis is the calculation of the contribution of the industry to the public finances of the country. In the case of the retail food industry, the direct taxes paid by firms and their employees provide $733.45 billion to the Federal Government and $525.25 billion to state and local governments. These figures do not include state and local sales and excise taxes that might be incurred by consumers.
Table 1 presents a summary of the total economic impact of the food and agriculture industries in the United States. Summary tables for the United States, individual states and congressional districts are included on the website at www.feedingtheeconomy.com.
Model Description and Data
The economic impact study begins with the IMPLAN model of the United States economy. Food-related IMPLAN industries are identified, and a matrix of state-by-state employment in the food industries is constructed. Since the most recent IMPLAN model is based off of 2023 employment and output data, the growth rate in these industries through the middle of 2024 is applied. The growth trends are based on monthly jobs data by NAICS sector, as recorded by the Bureau of Labor Statistics’ Quarterly Census of Employment and Wages.5 Combining the original industry job with the growth in employment in the industry, jobs are estimated as of the middle of 2024. A percentage break is applied to any IMPLAN industry which has significant business outside the scope of the food industry in order to isolate that portion of business related to food. Product breaks are based off the 2017 Economic Census of Retail Trade and the 2017 Economic Census of Wholesale Trade (the most recent data available).6 The intuition being, if ten percent of a commercial equipment wholesaler’s business is moving and storing food-related products, then ten percent of the commercial equipment wholesale jobs in that state should be considered food industry jobs. The job estimates are then run through the IMPLAN Input-Output model to estimate wages, output, and business taxes, as well as the supplier and induced impacts.
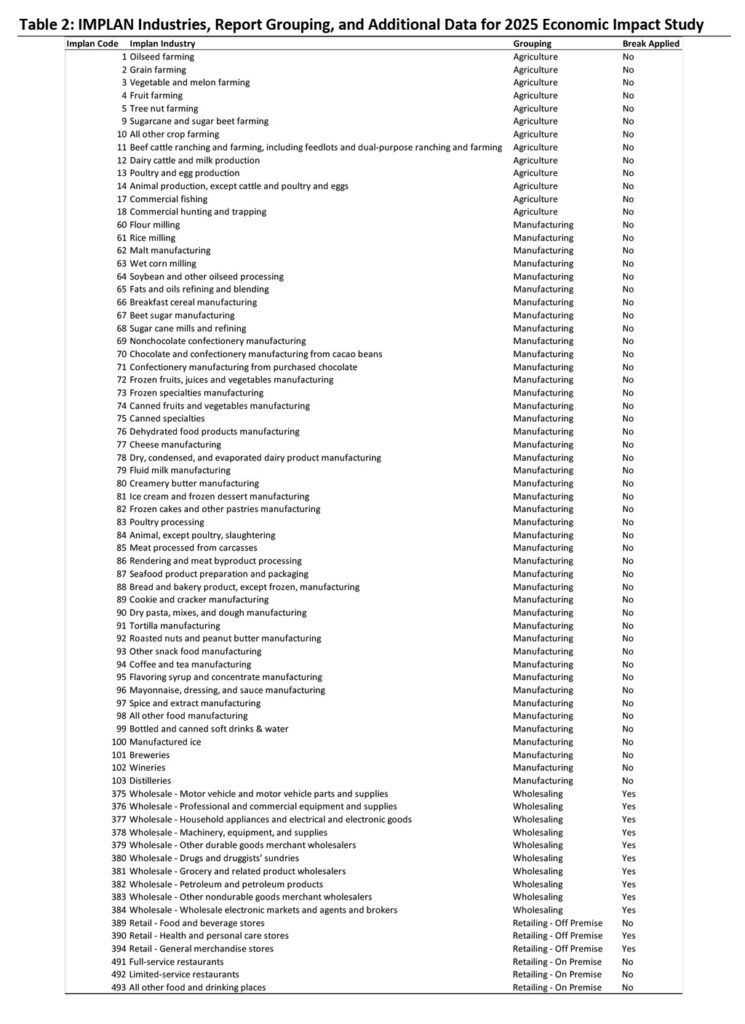
Table 2 at the end of the document summarizes the industries included in the study. The first two columns are the IMPLAN code and industry for those identified as food-related. The third column identifies which category corresponds with the particular industry. These are the categories presented on the data tables. The final column identifies which industries have a percentage applied to reflect only the food-related share of business. For those marked ‘no’, all jobs are assumed to be food-related; For those marked ‘yes’, the industry does business outside of the scope of the food industry and a percentage break is applied.
IMPLAN Methodology 7
Francoise Quesnay one of the fathers of modern economics, first developed the analytical concept of inter-industry relationships in 1758. The concept was actualized into input-output analysis by Wassily Leontief during the Second World War, an accomplishment for which he received the 1973 Nobel Prize in Economics.
Input-Output analysis is an econometric technique used to examine the relationships within an economy. It captures all monetary market transactions for consumption in a given period and for a specific geography. The IMPLAN model uses data from many different sources – as published government data series, unpublished data, sets of relationships, ratios, or as estimates. The IMPLAN Group, LLC gathers this data, converts it into a consistent format, and estimates the missing components.
There are three different levels of data generally available in the United States: federal, state and county. Most of the detailed data are available at the county level, but there are many issues with disclosure – especially in the case of smaller industries. IMPLAN overcomes these disclosure problems by combining a large number of datasets and by estimating those variables that are not found from any of them. The data is then converted into national input-output matrices (Use, Make, By-products, Absorption and Market Shares) as well as national tables for deflators, regional purchase coefficients and margins.
The IMPLAN Make matrix represents the production of commodities by industry. The Bureau of Economic Analysis (BEA) Benchmark I/O Study of the US Make Table forms the bases of the IMPLAN model. The Benchmark Make Table is updated to current year prices and rearranged into the IMPLAN sector format. The IMPLAN Use matrix is based on estimates of final demand, value-added by sector and total industry and commodity output data as provided by government statistics or estimated by IMPLAN. The BEA Benchmark Use Table is then bridged to the IMPLAN sectors. Once the re-sectoring is complete, the Use Tables can be updated based on the other data and model calculations of interstate and international trade.
In the IMPLAN model, as with any input-output framework, all expenditures are in terms of producer prices. This allocates all expenditures to the industries that produce goods and services. As a result, all data not received in producer prices is converted using margins which are derived from the BEA Input-Output model. Margins represent the difference between producer and consumer prices. As such, the margins for any good add to one.
Deflators, which account for relative price changes during different time periods, are derived from the Bureau of Labor Statistics (BLS) Growth Model. The 224 sector BLS model is mapped to the 528 sectors of the IMPLAN model. Where data are missing, deflators from BEA’s Survey of Current Businesses are used.
Finally, the Regional Purchase Coefficients (RPCs) – essential to the IMPLAN model – must be derived. IMPLAN is derived from a national model, which represents the “average” condition for a particular industry. Since national production functions do not necessarily represent particular regional differences, adjustments need to be made. Regional trade flows are estimated based on the Multi-Regional Input-Output Accounts, a cross-sectional database with consistent cross interstate trade flows developed in 1977. These data are updated and bridged to the 528 sector IMPLAN model.
Once the databases and matrices are created, they go through an extensive validation process. IMPLAN builds separate state and county models and evaluates them, checking to ensure that no ratios are outside of recognized bounds. The final datasets and matrices are not released before extensive testing takes place.
Differences Compared to Last Year’s Study
The models developed by JDA for Feeding the Economy use the 2023 IMPLAN model, the latest available at the time the model was constructed. Each year’s model has different multipliers associated with it, reflecting the realities of the general economy at that point in time. This leads to variability in supplier and induced jobs.
Last year, Feeding the Economy was based on the 2022 IMPLAN model which was still impacted by support and transfer payments, as well as other government actions in response to the COVID outbreak beginning in 2020. Generally, this means the ratio of taxes to jobs and output were lower than during a normal year and in many cases might be negative. JDA has worked with IMPLAN and developed a number of adjustments to the tax models to mitigate those impacts; however, there were still many
anomalies that are a result of the massive amounts of tax subsidies, tax cuts and direct payments to companies and individuals resulting from policies associated with COVID-19.
The data used to develop the 2023 IMPLAN tables are likely to still reflect some minor impacts from COVID-19; and show much larger tax figures as the effects of the response to the virus will be eliminated from the government tax data.
These models reflect the best data and modeling techniques available now and should provide an accurate measure of the economic footprint of the industry today. Any errors are unintentional and are strictly those of John Dunham & Associates and should not reflect on the quality of data provided by the Goodstone Group.
About John Dunham & Associates
John Dunham & Associates (JDA) is a leading economic consulting firm specializing in the economics of fast-moving issues. JDA is an expert at translating complex economic concepts into clear, easily understandable messages for a wide range of audiences. JDA’s clients have included a wide variety of businesses and organizations, including some of the largest Fortune 500 companies in America.
John Dunham is a professional economist with nearly 40 years of experience. He holds a Master of Arts degree in Economics from the New School for Social Research as well as a Master of Business Administration from Columbia University. He also has a professional certificate in Logistics from New York University. Mr. Dunham has worked as a manager and an analyst in both the public and private sectors. He has experience in conducting cost-benefit modeling, industry analysis, transportation analysis, economic research, and tax and fiscal analysis. As a senior economist for Philip Morris, he developed tax analysis programs, increased cost-center productivity, and created economic research operations. He has presented testimony on economic and technical issues in federal court and before federal and state agencies.
Prior to Phillip Morris John was an economist with the Port Authority of New York and New Jersey, the Philadelphia Regional Port Authority, and the City of New York’s Department of Ports & Trade.
- $50.90 trillion. See, Gross Output by Industry, US Department of Commerce, Bureau of Economic Analysis, December 19, 2024, https://apps.bea.gov/iTable/?reqid=150&step=2&isuri=1&categories=gdpxind#eyJhcHBpZCI6MTUwLCJzdGVwcyI6WzEsMiwzXSwiZGF0YSI6W1siY2F0ZWdvcmllcyIsIkdkcHhJbmQiXSxbIlRhYmxlX0xpc3QiLCIxNSJdXX0=
- The analysis relies on zip code-based employment data supplied by Infogroup, the leading provider of business and consumer data for the top search engines and leading in-car navigation systems in North America. Infogroup gathers data from a variety of sources, by sourcing, refining, matching, appending, filtering, and delivering the best quality data. Infogroup verifies its data at the rate of almost 100,000 phone calls per day to ensure absolute accuracy.
- These firms would more appropriately be considered as part of the indirect firm’s industries.
- Often economic impact studies present results with very large multipliers – as high as 4 or 5. These studies invariably include the firms supplying the induced industries as part of the induced impact. John Dunham & Associates believes that this is not an appropriate definition of the induced impact and as such limits this calculation only to the effect of spending by direct and indirect employees.
- Quarterly Census of Employment and Wages, US Department of Labor, Bureau of Labor Statistics, at: https://www.bls.gov/cew/data.htm
- 2017 Economic Census, Retail Trade: Summary Statistics for the U.S., States, and Selected Geographies: 2017, January 2025, US Department of Commerce, Bureau of the Census, at: https://www.census.gov/data/tables/2017/econ/economic-census/naics-sector-44-45.html and 2017 Economic Census, Other Services (Except Public Administration): Geographic Area Series: Other Services (except Public Administration): Summary Statistics for the U.S., States, and Selected Geographies: 2017, January 2025, US Department of Commerce, Bureau of the Census, at: https://www.census.gov/data/tables/2017/econ/economic-census/naics-sector-81.html; and 2017 Economic Census, Wholesale Trade: Product Statistics All Sectors: Products by Industry for the U.S.: 2017, January 2025, US Department of Commerce, Bureau of the Census, at: https://www.census.gov/data/tables/2017/econ/economic-census/naics-sector-42.html
- IMPLAN® model, 2023 Data, using inputs provided by the user and IMPLAN Group LLC, IMPLAN System (2024), 16905 Northcross Dr., Suite 120, Huntersville, NC 28078, www.IMPLAN.com.